Average Engagement (X)
In the "Average Engagement" section, you can review average values for various metrics such as "Number of Own Posts," "Average Replies to Own Posts," "Average Reposts (Retweets) to Own Posts," and "Average Likes to Own Posts." These metrics are displayed in graphs and tables, segmented by time period.
In each graph and table, values are displayed based on the date the post was made from your X (Twitter) account. For example, if a reply to a post made on July 1st occurs on July 2nd, it will be counted as a reply for July 1st.
Available Analytics Items
- Average Engagement Summary
- Average Engagement
- Post List
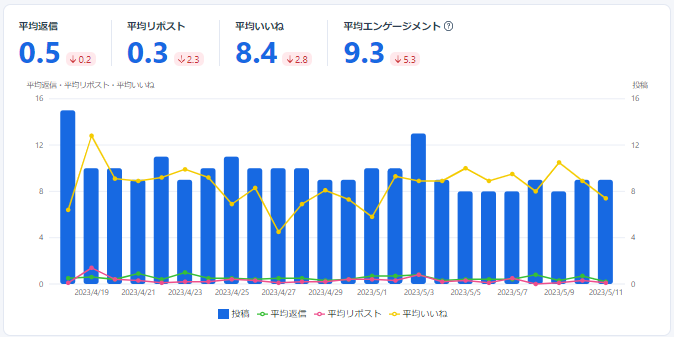
Average Engagement Summary
You can view graphs showing replies, reposts, likes, and engagement per post, segmented by time period.
Average Engagement

Post List
In the Post List, you can view the number of replies, reposts (retweets), likes, engagement, and impressions for your posts in a tabular format. By default, posts are sorted in descending order of engagement. You can also search for specific posts.
