Engagement (X)
In Engagement, you can review the performance of user interactions. By analyzing high-engagement posts, you can inform your future account management strategy.
For each graph and table, metrics are displayed based on the date your posts were published from your X (formerly Twitter) account. For example, if a reply to a post published on July 1st occurs on July 2nd, it will be displayed as a reply for July 1st.
Available Analytics Items
- Engagement Summary
- Engagement
- Top Performing Posts
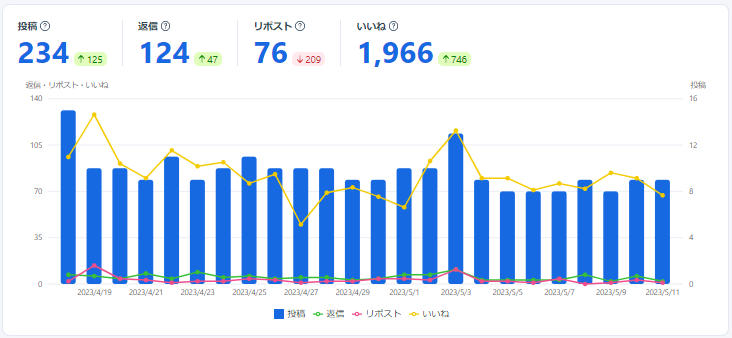
Engagement Summary
In the Engagement Summary, you can view graphs showing the total counts for each type of interaction: "Number of your posts," "Number of replies to your posts," "Number of Reposts (Retweets) to your posts," and "Number of likes on your posts," as well as their respective counts broken down by period.
Engagement
In Engagement, you can view table-formatted data showing the counts for "Number of your posts," "Number of replies to your posts," "Number of Reposts (Retweets) to your posts," and "Number of likes on your posts," broken down by period.

Top Performing Posts
The Top Performing Posts section allows you to view "Replies," "Reposts (Retweets)," "Likes," "Engagement," and "Impressions" for posts within a specified period in a table format. By default, posts are sorted by engagement in descending order. You can also search for specific posts.
