Analyze posts (Post performance)
Post performance allows you to analyze engagements for each Post from your Social profile.
It supports a wide variety of analysis items, including Impressions, Engagements, Comments, Replies, Likes, Reposts (retweets), as well as URL clicks, Hashtag clicks, detail clicks, and video views. The supported analysis items vary depending on the Social profile.
Supported Plans
- Business plan・Enterprise plan
- All features are available.
- Personal plan・Professional plan
- You can check numerical values such as the number of Engagements for each Post, but graph display and period comparison are not available.
- *Only YouTube is available for all plans.
Supported Social Profiles
- X (Twitter) Account
- Instagram Account
- YouTube Channel
- Threads Account
- TikTok Account
Viewable Posts
You can view all Posts acquired by SocialDog except Reposts.
Some Posts are not acquired by SocialDog and therefore not displayed. For details, please refer to Data acquired from social media and acquisition timing.
Viewable Metrics
Likes, Reposts, Impressions, profile link taps, and the number of times users go back and forth in Instagram Stories are among the more than 70 rich metrics acquired from each Social profile, displayed in graphs and tables.
- The metrics that can be displayed differ for each Social profile.
- For a list of metrics that can be displayed for each Social profile, please refer to Analyzable Items.
- To check the average value of each engagement rate (items named "〇〇 / Reach" or "〇〇 / Impressions") (displayed at the top of the Post list), the displayed Social profile must support both the numerator and denominator metrics.
Personal plan・Professional plan can only display the following metrics:
- Impressions
- Engagements
- Comments・Replies
- Likes・High ratings
- Reposts
- Quote Posts
- Saves・Bookmarks
Upgrading to a Business plan・Enterprise plan allows you to view all metrics.
Check Engagements for Posts
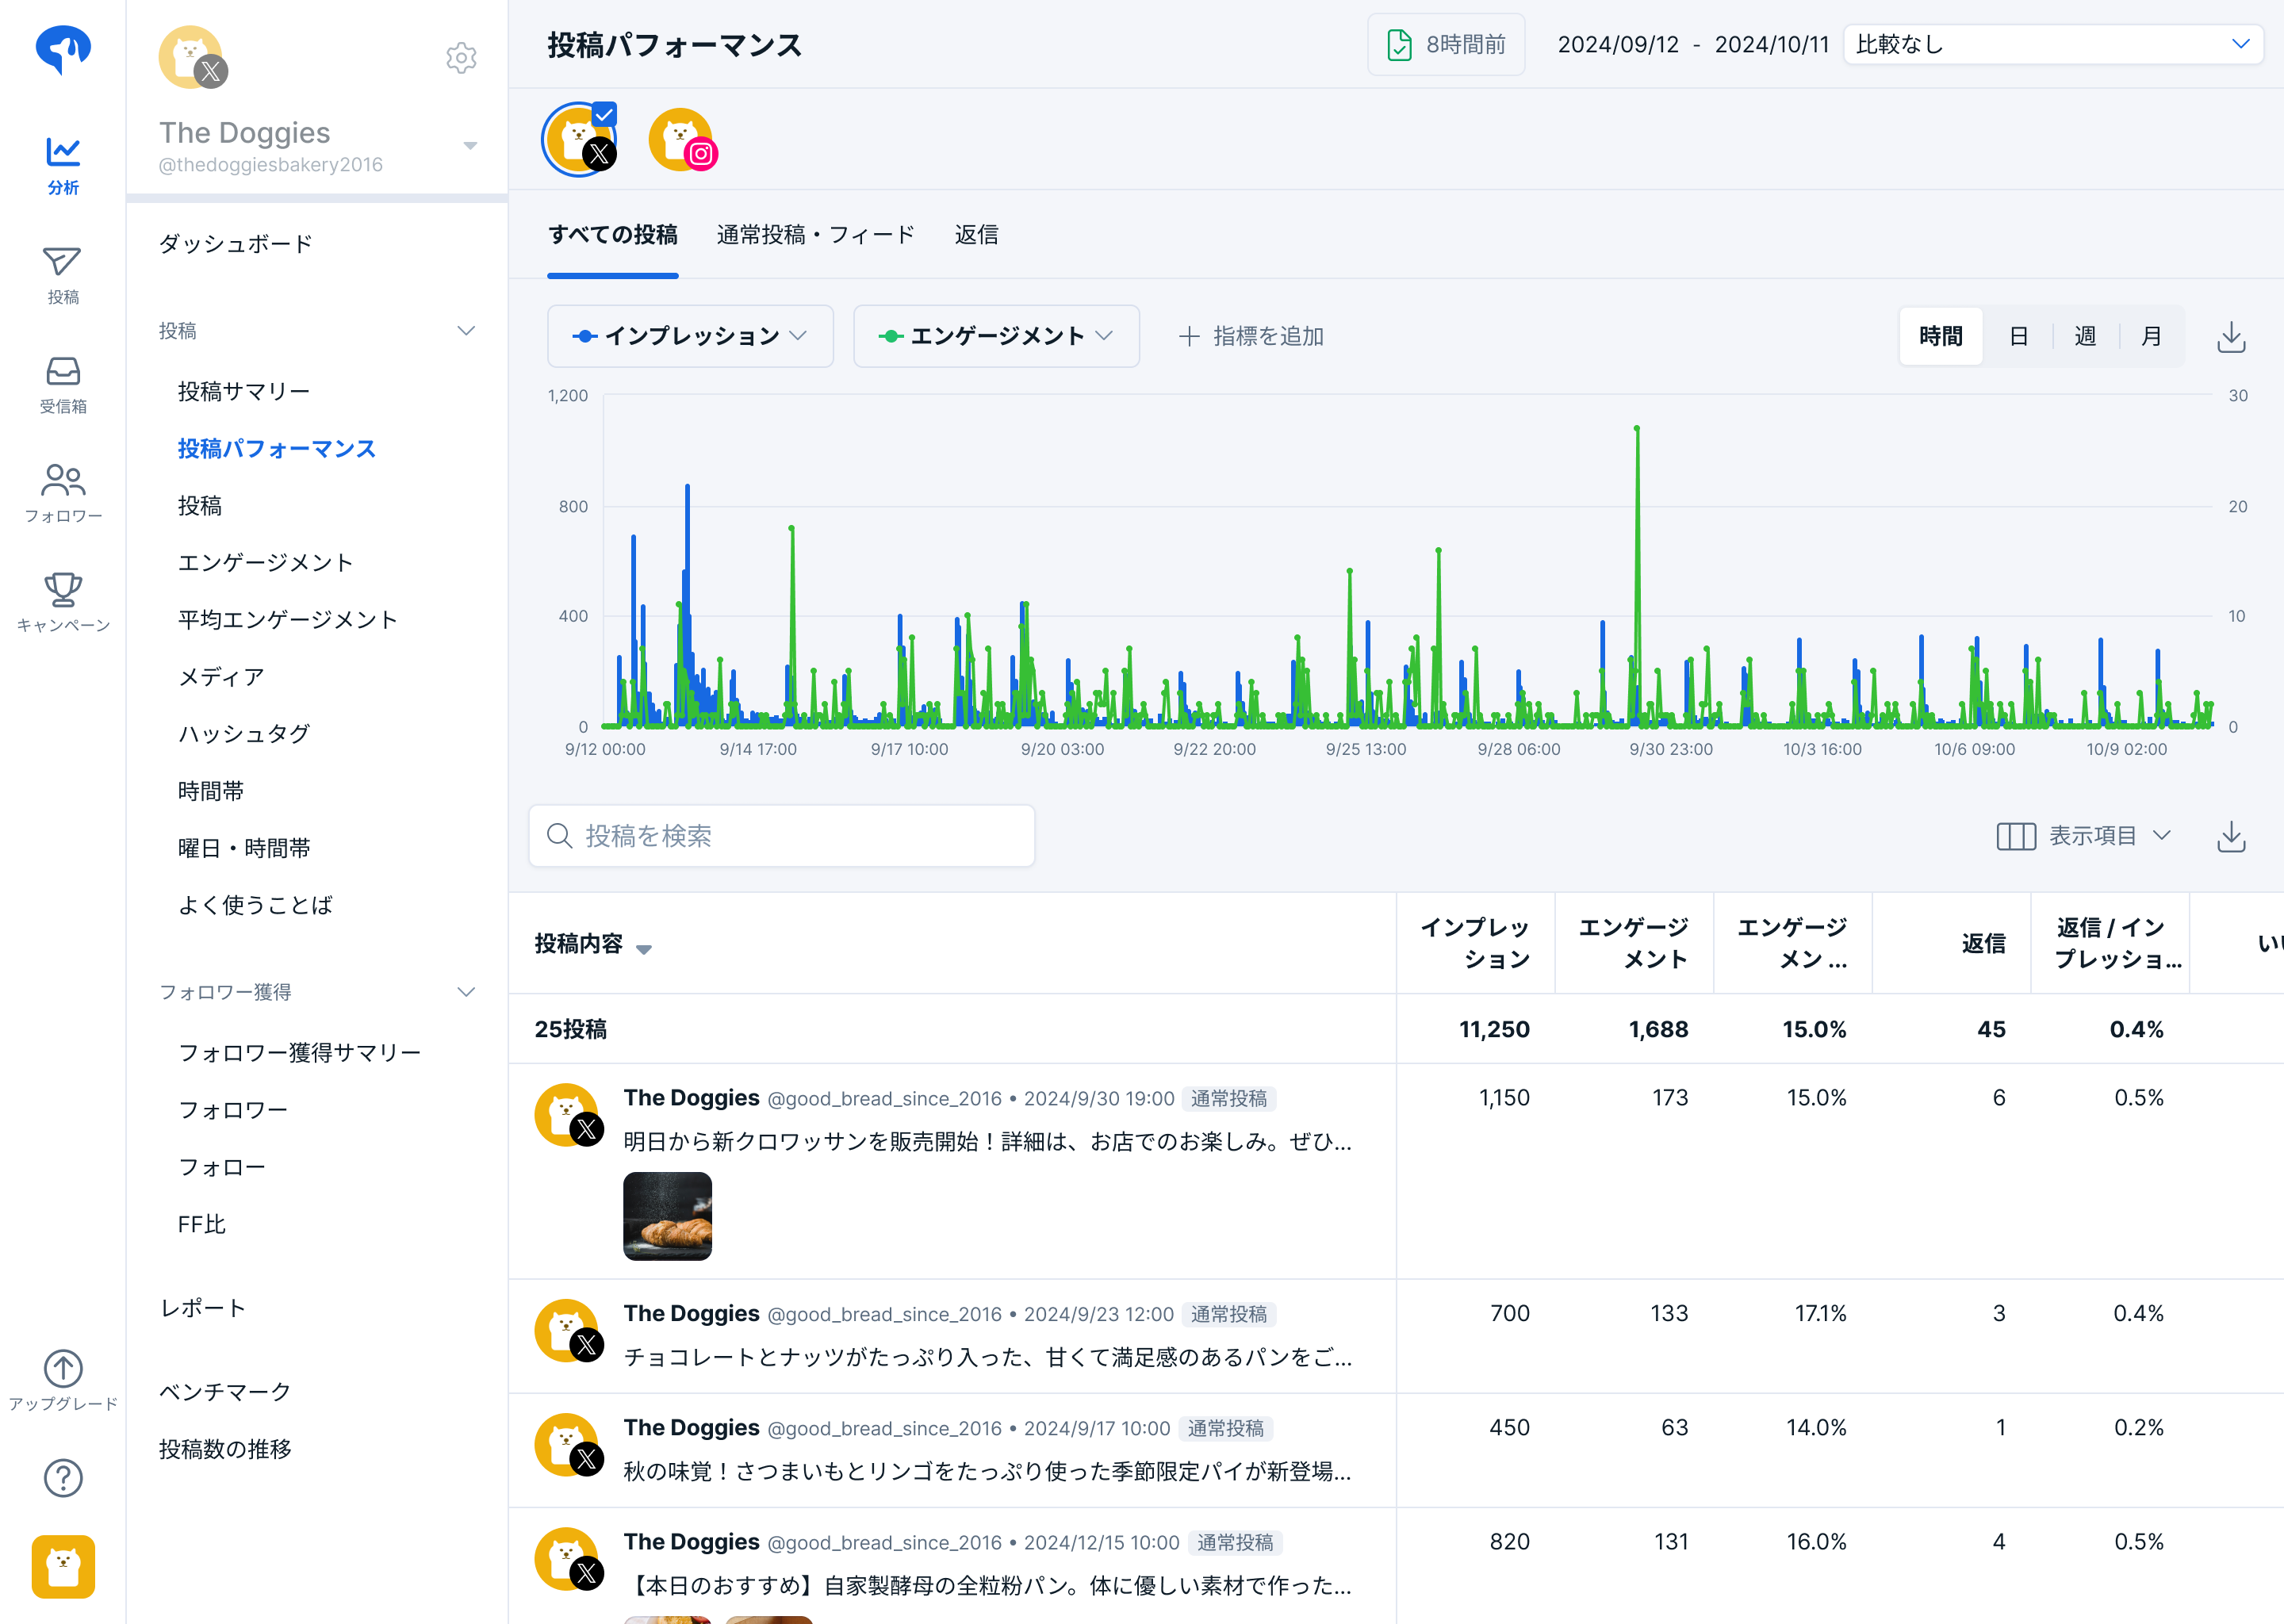
- Click [Analytics] → [Post performance].
- Click the Social profile you want to analyze.
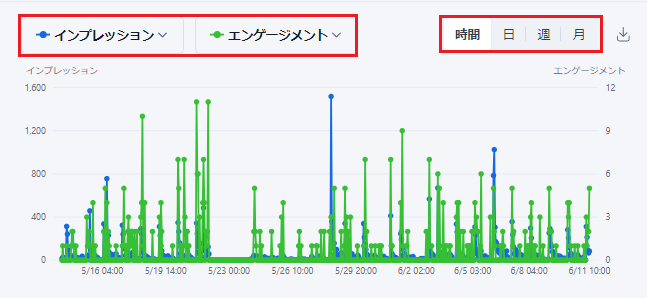
- Select the period and display unit (monthly, weekly, daily).
- You can check the graph of the time-series trend of metrics and the latest values of Post metrics during the period.
Graph Display Content (X (Twitter)・Instagram・Threads・TikTok)
Metrics Displayed
- Total Engagements that occurred in each period
- Engagements from periods outside the data collection scope will not be displayed on the graph, excluding already acquired data.
Aggregation Criteria
- Date when Impressions・Engagements were acquired
- For example, if a Reply is made to a Post on July 1 on July 2, it will be displayed as a Reply on July 2.
Please note that the displayed values may differ from other Post Analysis features on X. Other Post Analysis features on X aggregate based on the Post date. For example, if a Reply is made to a Post on July 1 on July 2, it will be displayed as a Reply on July 1.
For details on acquired data and update timings, please refer to Data acquired from social media and acquisition timing.
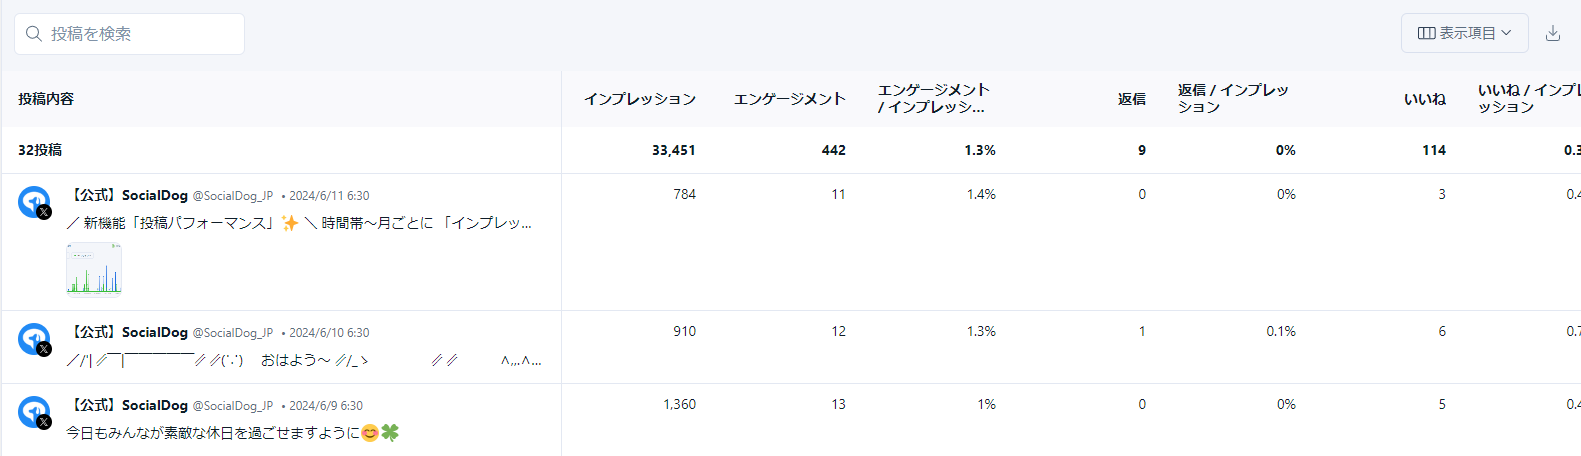
Post List Display Content
Metrics Displayed
- Latest value for each Post
- Data outside the selected period may be included.
Posts Displayed
- Posts made during the period
Check Engagements for Specific Posts Only (X (Twitter)・Instagram・Threads・TikTok)
You can check the time-series trend (hourly, daily, weekly, monthly) of Impressions and Engagements after a Post. This can be used for initial performance analysis.
- Open [Analytics] → [Post performance] and display the Post you want to check.
- Click the Post you want to check in the Post list.
- On the "Post Details" screen, you can check the trend of metrics for each Post.
Post Details Display Content
The values displayed at the top of each graph in "Post Details" are the Engagements acquired within the period (not the latest values).
- Clicking [Actual / Impressions] at the top right of the screen allows you to view the values divided by the number of Impressions (engagement rate) in a graph. On Instagram, clicking [Actual / Reach] allows you to view the values divided by the number of Reach (engagement rate) in a graph.
- You can check metrics in table format in the table at the bottom of the Post details page.
- X (Twitter) Posts
- By default, the displayed data will be the total data for 2 weeks from the Post date.
- Instagram Posts
- Monthly display is not supported.
- For Stories, only data for 24 hours after posting can be checked.
- Threads Posts
- Monthly display is not supported.
- TikTok Posts
- Monthly display is not supported.
Acquire Past Metric Data for Specific Posts (X (Twitter) Only)
If you set the analysis period displayed on the Post details screen to a period later than 2 weeks, you can acquire missing data for that period.
- Missing data can be acquired going back up to 1 year from the current time. If data has already been acquired, periods older than 1 year can also be selected.
- Acquired data will also be reflected in graphs and the Post list screen.
- Acquisition of missing data must be done from the Post details screen for each Post.
Switch the Social Profile for Analysis
- On the Post performance screen, click the Account icon at the top to switch the target Account for display.
Display Data from Multiple Social Profiles Simultaneously
You can display data from multiple Social profiles simultaneously. In the graph, the total Engagements for all checked Social profiles will be displayed. In the Post list, all Posts from all checked Social profiles will be displayed.
- Hover your mouse cursor over the Social profile icon.
- Check the [checkbox] to display information from multiple Social profiles simultaneously.
Filter by Post Type
You can filter Post types by clicking "All Posts" or similar at the top.
- Click either [All Posts], [Normal Posts・Feed], or [Replies] at the top.
- Only Posts of the corresponding type will be displayed.
Filterable Post Types
- All Posts
- Displays all Posts.
- Normal Posts・Feed
- Displays Posts other than Replies on X (Twitter), only Feed Posts on Instagram, only normal Posts on Threads, and all Posts on TikTok.
- Replies
- Displays only Reply Posts (supported on X (Twitter)・Threads).
- Reels
- Displays only Reel Posts (supported on Instagram only).
- Stories
- Displays only Stories Posts (supported on Instagram only).
- Ghost Posts
- Displays only Ghost Posts (supported on Threads only).
Change Analysis Items Displayed in Graph
The analysis items displayed in the graph can be changed using the dropdown menu, and up to two analysis items can be displayed simultaneously.
Compare Two Periods (X (Twitter)・Instagram・Threads・TikTok)
You can compare the data for the selected period (e.g., May 10, 2025 - May 20, 2025) with the data for the comparison period, displayed side-by-side in graphs and tables.
The comparison period can be selected from the following:
- Previous period: The period immediately preceding the selected period, with the same number of days (e.g., April 30, 2025 - May 9, 2025)
- Same period last month: The same date range as the selected period, one month prior (e.g., April 10, 2025 - April 20, 2025)
- Same period last year: The same date range as the selected period, one year prior (e.g., May 10, 2024 - May 20, 2024)
Dimension: Post Tags
You can categorize Posts with tags and analyze their performance by tag.
Create Post Tags
Team administrators and users with the "Admin" or "Editor" Role for the Social profile can create Post tags.
- Click [Analytics] → [Post performance].
- In the Post list, click the tag icon displayed for each Post.
- When the dropdown menu appears, click "+Create New Tag".
- Enter the tag name in the text field in the dialog and click "Create".
- The created tag will be automatically linked to the corresponding Post.
Edit Post Tags
Team administrators can Edit Post tag names.
- In the Post list, click the tag icon displayed for each Post.
- Click the pencil icon to the right of the tag you want to Edit.
- Change the tag name in the text field in the dialog and click [Save].
Delete Post Tags
Team administrators and users with the "Admin" or "Editor" Role for the Social profile can Delete Post tags.
- In the Post list, click the tag icon displayed for each Post.
- Click the pencil icon to the right of the tag you want to Delete.
- Click [Delete] in the dialog, then click [Delete] in the confirmation dialog.
Link Tags to Posts
Team administrators, general users, and users with the "Admin" or "Editor" Role for the Social profile can link tags to Posts.
- In the Post list, click the tag icon displayed for each Post.
- Check the checkbox next to the tag in the tag list displayed in the dropdown menu to link the tag to the Post.
Unchecking the checkbox will unlink it.
Analyze Performance by Post Tag
Team administrators, general users, and users with the "Admin", "Editor", or "Viewer" Role for the Social profile can check tag-specific performance.
By switching the Post list dimension to "Post Tags", you can compare and analyze tag-specific performance in tables and graphs.
Dimension: Social Profile
By switching the Post list dimension to "Social profile", you can compare and analyze Social profile-specific performance in tables and graphs.
Graph Display Content
Metrics Displayed
- Total Engagements per Social profile that occurred in each period
Social Profile List Display Content
Metrics Displayed
- Total value per Social profile for each Post
Posts Aggregated
- Posts made during the period
Perform Actions on Posts (X (Twitter) Only)
For X (Twitter) Posts, clicking the "..." button displayed on each row allows you to Add another Post (Reply), or create a Repost (retweet) or Quote Post (quote tweet).