Instagram Post Summary
In "Post Summary," you can review basic performance information of your posts such as "Number of Posts," "Impressions, Reach, Engagement Rate," "Engagement by Media Type," and "Average Engagement by Hashtag Presence."
Analysis Items Available
- Post Summary
- Impressions, Reach
- Engagement Rate
- Average Engagement by Media Type
- Media
- Average Engagement by Hashtag Presence
- Hashtags
- Average Engagement by Hashtag
- Posts by Day of Week and Time
- Engagement
*Due to Instagram's data acquisition specifications, data up to the previous day can be displayed.
In "Post Summary," feed posts and Reels posts are displayed as analysis targets. Stories posts are not displayed.
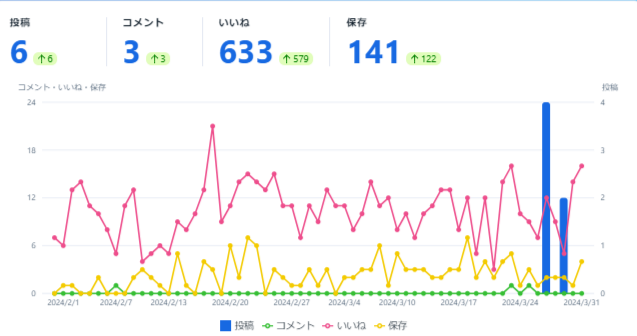
Post Summary
- Trends in Posts / Comments / Likes / Saves
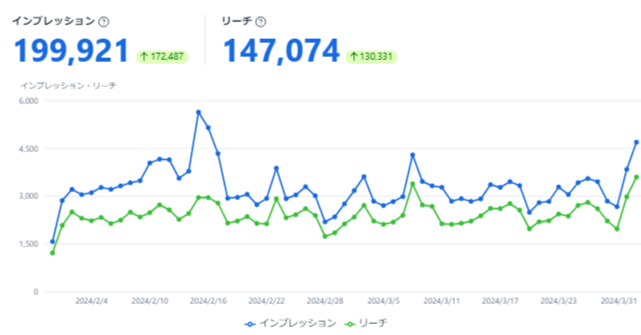
- Trends in Impressions / Reach
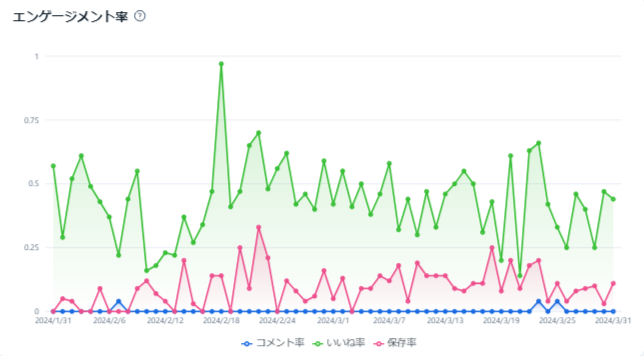
- Trends in Engagement Rate
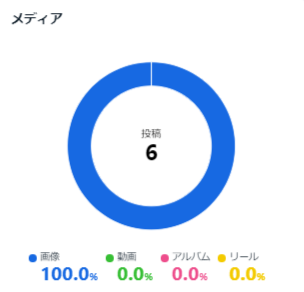
- Average Engagement by Media Type
- Media
- Average Engagement by Hashtag Presence
- Hashtags
- Average Engagement by Hashtag
- Posts by Day of Week and Time
- Engagement
- Posts
- Impressions
- Reach
- Comments
- Likes
- Saves
- Engagement
- Average Impressions
- Average Reach
- Average Comments
- Average Likes
- Average Saves
- Average Engagement
Post Summary
In "Post Summary," you can view data such as the "Number of Posts," "Number of Comments," "Number of Likes," and "Number of Saves" that you have made, displayed in a graph.
Impressions, Reach
In "Impressions, Reach," you can view the "Impressions and Reach" of your posts. Impressions indicate the number of times a post was displayed, while Reach indicates the number of unique users who saw the post.
Engagement Rate
In "Engagement Rate," you can view the "Comment Rate," "Like Rate," and "Save Rate." The Comment Rate, Like Rate, and Save Rate are calculated by dividing the respective number of comments, likes, and saves by Reach.
Average Engagement by Media Type
In "Average Engagement by Media Type," you can view "Impressions," "Reach," "Number of Comments," "Number of Likes," "Number of Saves," and "Number of Shares" for each media type. This allows you to quickly identify media types with high engagement.

Media
In "Media," you can view the distribution of your post media types in a graph.
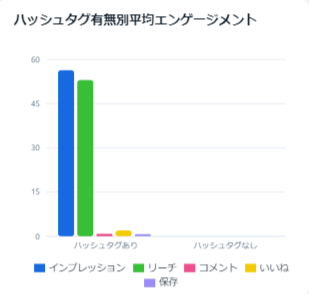
Average Engagement by Hashtag Presence
In "Average Engagement by Hashtag Presence," you can view "Impressions," "Reach," "Number of Comments," "Number of Likes," "Number of Saves," and "Number of Shares" for your posts, categorized by the presence or absence of hashtags.
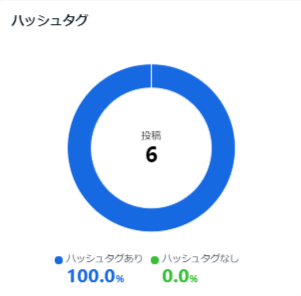
Hashtags
In "Hashtags," you can view the distribution of hashtag presence in your posts in a graph.
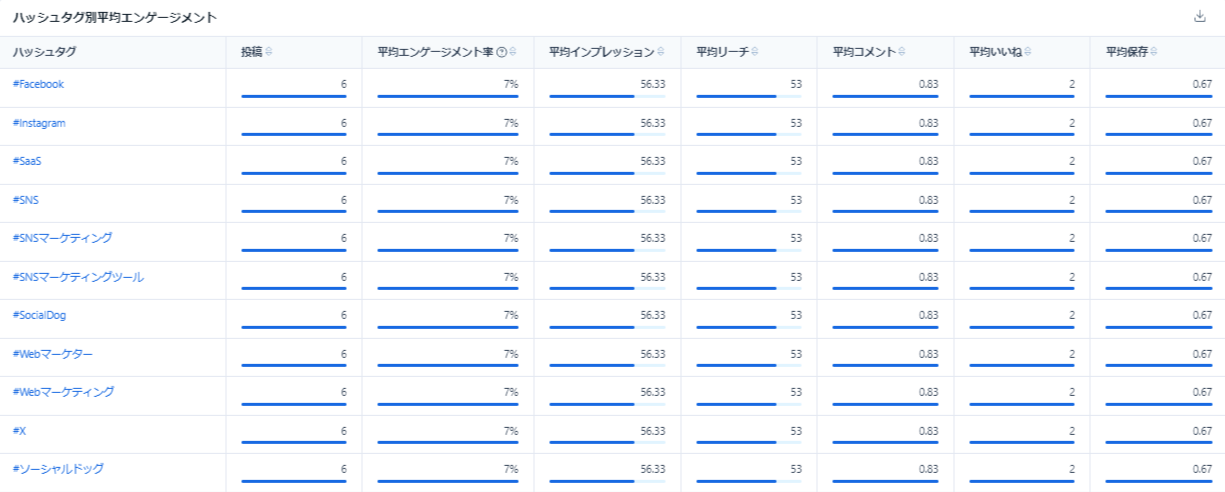
Average Engagement by Hashtag
In "Average Engagement by Hashtag," you can view the following metrics for each hashtag used:
- Number of Posts
- Average Engagement Rate
- Average Impressions
- Average Reach
- Average Comments
- Average Likes
- Average Saves
- Average Shares
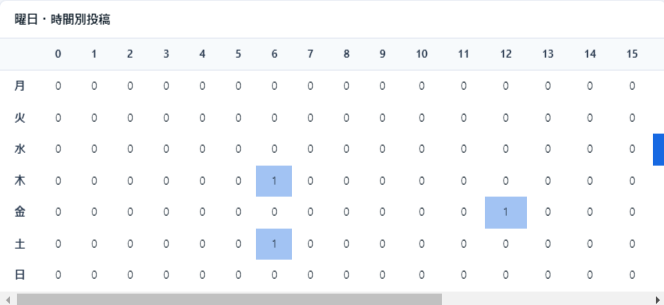
Posts by Day of Week and Time
In "Posts by Day of Week and Time," you can view the distribution of your post dates and times.
Engagement
In "Engagement," you can view the following metrics daily:
- Number of Posts
- Impressions
- Reach
- Number of Comments
- Number of Likes
- Number of Saves
- Number of Shares
- Number of Engagements
- Average Impressions
- Average Reach
- Average Comments
- Average Likes
- Average Saves
- Average Shares
- Average Engagement
